

Top News
Sri Lanka’s Exports Surpass US$ 13.6 Bn in the First Nine Months of 2026, Recording 5% Growth

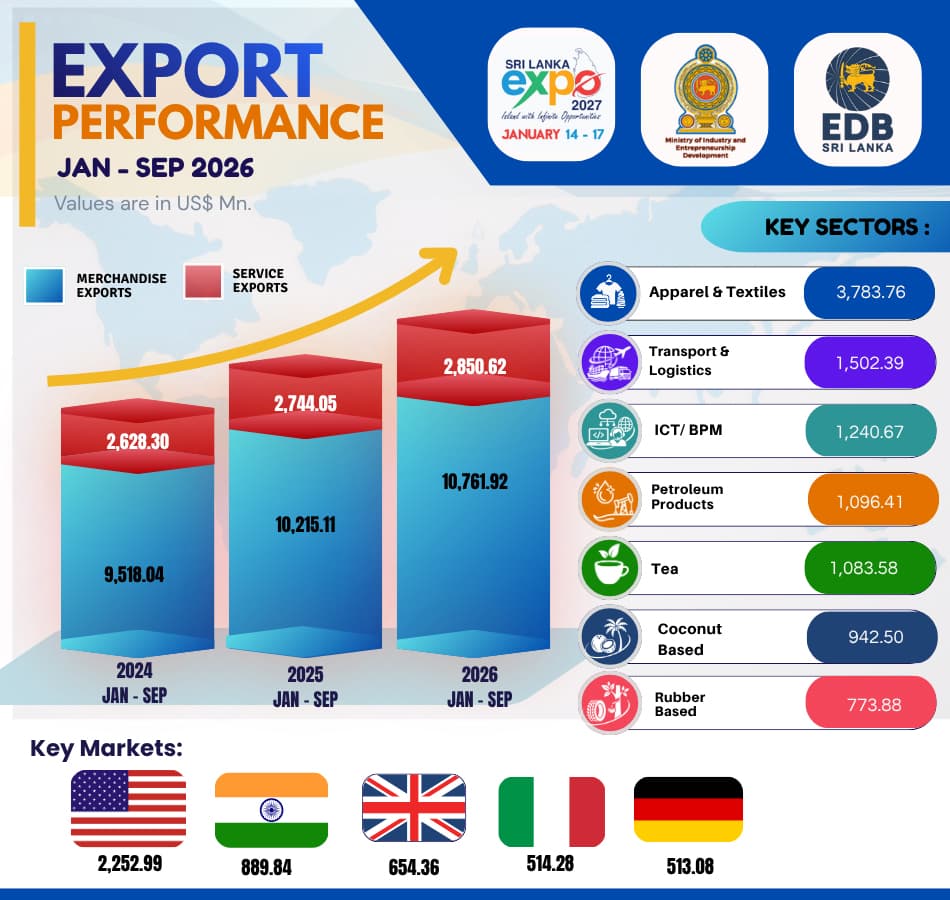
Sri Lanka’s total exports have reached US$ 13.61 Bn during the first nine months of 2026, recording a year-on-year growth of 5.04% compared with US$ 12.96 Bn in the corresponding period of 2025. This positive performance reflects the continued expansion of the country’s export sector, supported by growth in both merchandise and services exports. According to the latest export performance figures released by Sri Lanka Customs, together with the EDB’s estimates for gems and jewellery and petroleum products, merchandise exports grew by 5.35% to US$ 10.76 Bn during January–September 2026, compared with US$ 10.22 Bn recorded in the corresponding period of 2025. Meanwhile, services exports grew by 3.88% to US$ 2.85 Bn, up from US$ 2.74 Bn in the corresponding period of the previous year. The performance of both segments highlights the importance of strengthening Sri Lanka’s export competitiveness while diversifying its sources of export earnings.  Strong Export Performance in September 2026 Sri Lanka recorded a particularly strong performance in September 2026, with total exports reaching US$ 1.69 Bn, an impressive year-on-year increase of 17.23% compared with US$ 1.44 Bn in September 2025. Merchandise exports were the main driver of this monthly growth, increasing by 21.66% to US$ 1.39 Bn, compared with US$ 1.14 Bn in September 2025. Services exports also recorded a positive performance, rising by 0.67% to US$ 306.17 Mn from US$ 304.14 Mn in the corresponding month last year. The strong growth in merchandise exports during September contributed significantly to the overall improvement in export earnings, reinforcing the positive trajectory of Sri Lanka’s export sector. Sustaining Export Growth Towards National Targets The export performance achieved during the first nine months of 2026 represents continued progress towards strengthening Sri Lanka’s position in international markets and expanding its contribution to the national economy. Sustaining this momentum will require continued efforts to diversify export products and markets, enhance value addition, improve product quality and standards, and strengthen the competitiveness of Sri Lankan exporters. The National Export Development Plan (NEDP) 2026–2030, which targets US$ 36 Bn in annual export earnings by 2030, provides a strategic framework for accelerating export growth through improved trade facilitation, market development, investment promotion, innovation, and enhanced private-sector engagement. Building on the positive results recorded in the first nine months of 2026, continued coordination among government institutions, industry stakeholders, and exporters will be essential to maintaining growth, addressing emerging challenges, and realising Sri Lanka’s long-term export development ambitions. Commenting on the export performance in September 2026, Mr.Mangala Wijesinghe, Chairman and Chief Executive Officer of the Sri Lanka Export Development Board (EDB), stated: “Sri Lanka’s total exports reaching US$ 13.61 Bn during the first nine months of 2026, representing a growth of 5.04% compared with the corresponding period of 2025, reflects the continued resilience and progress of our export sector. Particularly encouraging is the strong performance recorded in September, when total exports increased by 17.23% year-on-year to US$ 1.69 Bn, driven by a significant 21.66% growth in merchandise exports. This performance demonstrates the potential of Sri Lankan exporters to strengthen their presence in international markets despite an increasingly competitive global trading environment. As we move forward, our priority must be to sustain this growth momentum by strengthening the competitiveness of existing export sectors while accelerating the development of new products, services and markets. Enhancing value addition, promoting innovation and technology adoption, diversifying export markets, and integrating more deeply into global value chains will be essential to expanding export earnings and generating greater economic value for the country. The EDB remains committed to working closely with exporters, industry associations and relevant government institutions to address emerging challenges, improve the trade and investment environment, and facilitate greater access to international markets. Through the effective implementation of the National Export Development Plan 2026–2030 and strengthened collaboration among all stakeholders, we aim to build on these positive results, achieve sustainable export growth, and advance Sri Lanka towards its long-term ambition of reaching US$ 36 Bn in annual export earnings by 2030.”
 Sri Lanka’s Export Performance in Major Markets Among the top fifteen export destinations, several key markets, including United States, India, Italy, China, Turkey, Australia, Belgium, Mexico and Japan, recorded positive year-on-year growth both in September 2026 and cumulatively during January-September 2026. This positive performance across multiple key markets reflects sustained export growth and strengthening demand across these destinations. The United States, Sri Lanka’s largest single export destination, accounting for approximately 20.3% of total merchandise exports, recorded strong year-on-year growth of 18.06% in September 2026, with export earnings reaching US$ 281.84 Mn. Cumulative exports to the United States during January-September 2026 also recorded a marginal increase of 0.05%, reaching US$ 2,252.99 Mn compared with the corresponding period in 2025. This performance reinforces the continued importance of the US market to Sri Lanka’s merchandise exports, maintaining its position as the country’s leading export destination. India strengthened its position as Sri Lanka’s second-largest export destination, surpassing the United Kingdom, with cumulative exports increasing by 12.3% to US$ 889.84 Mn during January-September 2026. Exports to India also recorded robust year-on-year growth of 29.65% in September 2026, reaching US$ 113.22 Mn. In contrast, exports to the United Kingdom declined by 3.17% year-on-year to US$ 71.71 Mn in September 2026, while cumulative exports during January-September 2026 decreased by 9.33% to US$ 654.36 Mn. These trends highlight India’s growing importance as a key destination for Sri Lanka’s merchandise exports, alongside the continued significance of the UK market. The United Arab Emirates (UAE) recorded a 17.8% year-on-year decline in export earnings in September 2026, amounting to US$ 33.66 Mn. Cumulative exports to the UAE during January-September 2026 also declined by 10.5% compared with the corresponding period in 2025, reaching US$ 232.06 Mn. Despite this contraction, the UAE remained an important destination for Sri Lanka’s merchandise exports, highlighting its continued relevance in the country’s export market portfolio. Turkey recorded strong export growth of 64.22% in September 2026, with export earnings reaching US$ 30.71 Mn. Cumulative exports during January–September 2026 also increased substantially by 94.01% year-on-year, reaching US$ 218.24 Mn. This strong performance reflects improved market penetration, and growing demand for Sri Lankan products in the Turkey. Notably, tea exports to Turkey recorded strong year-on-year growth of 82.48% in September 2026, while cumulative tea exports during January–September 2026 increased by 126.51% compared with the corresponding period in 2025. This substantial growth highlights the expanding market for Sri Lankan tea in Turkey and presents opportunities to further strengthen market presence and expand export earnings. China also recorded strong export growth of 9.36% in September 2026, with export earnings reaching US$ 25.48 Mn. Cumulative exports to China during January–September 2026 also increased substantially by 16.46% year-on-year, reaching US$ 234.39 Mn. The strong performance was supported by notable growth in key export products, particularly activated carbon, which recorded year-on-year increases of 55.56% in September 2026 and 78.33% during January–September 2026, compared with the corresponding periods in 2025. Table 2 shows a comparative analysis of merchandise export performance across the top 15 export markets for September 2025 & 2026, along with the cumulative figures for the January- September period of 2025 & 2026. Table 2: Comparison of Merchandise Export Performance of Top 15 Export Destinations
 Exports to FTA Partners (India & Pakistan) September 2026 Exports to India and Pakistan collectively accounted for 9.04% of Sri Lanka’s total merchandise exports in September 2026, with combined export earnings reaching US$ 125.14 Mn, reflecting a 33.85% year-on-year increase. Exports to India grew by 29.65% to US$ 113.22 Mn, primarily driven by increased exports of pepper. Meanwhile, exports to Pakistan recorded a substantial year-on-year increase of 93.51%, reaching US$ 11.92 Mn. These gains highlight the positive export performance across both South Asian markets during the month. January – September 2026 During January–September 2026, export earnings to India increased by 12.3% year-on-year, reaching US$ 889.84 Mn. This growth was primarily driven by increased exports of pepper, boilers, piston engines, pumps and vacuum pumps, coconut shell charcoal, animal feed, and base metal products. Exports to Pakistan also recorded strong year-on-year growth of 33.59%, reaching US$ 74.73 Mn during the period. This performance was supported by increased exports of other textile articles, desiccated coconut, tea, and other articles of stone, highlighting the growing opportunities for Sri Lankan products in the Pakistani market. Sri Lanka’s Export Performance in Regions Table 3 shows the comparison of region wise exports for September 2025 & 2026, along with the cumulative figures for the January–September period of 2025 & 2026. Table 3: Comparison of Region wise Merchandise Export Performance
 Exports to the European Union (EU), which accounted for approximately 20.12% of Sri Lanka’s total merchandise exports, recorded a modest year-on-year increase of 1.92% in September 2026 compared with the corresponding month in 2025. However, cumulative exports to the EU during January-September 2026 recorded a marginal decline of 0.15% year-on-year. These relatively modest changes indicate a broadly stable export performance in the EU market, with monthly growth partially offset by the slight contraction in cumulative export earnings. Among the top five EU export markets, Italy remained the leading destination, with export earnings reaching US$ 514.28 Mn, reflecting a year-on-year increase of 1.48% during January–September 2026. Exports to Germany amounted to US$ 513.08 Mn, recording a decline of 4.27%, while exports to the Netherlands decreased by 5.35% to US$ 328.12 Mn. Exports to France also declined by 6.54%, reaching US$ 198.77 Mn. In contrast, exports to Belgium increased by 3.16% to US$ 193.42 Mn during the same period, reflecting varied export performance across the major EU markets. Sources: Data were obtained from the Central Bank of Sri Lanka (CBSL) and Sri Lanka Customs. Export figures of Services, Gems & Jewellery, and Petroleum Products for September 2026 were estimated by the EDB.


Strong Export Performance in September 2026 Sri Lanka recorded a particularly strong performance in September 2026, with total exports reaching US$ 1.69 Bn, an impressive year-on-year increase of 17.23% compared with US$ 1.44 Bn in September 2025. Merchandise exports were the main driver of this monthly growth, increasing by 21.66% to US$ 1.39 Bn, compared with US$ 1.14 Bn in September 2025. Services exports also recorded a positive performance, rising by 0.67% to US$ 306.17 Mn from US$ 304.14 Mn in the corresponding month last year. The strong growth in merchandise exports during September contributed significantly to the overall improvement in export earnings, reinforcing the positive trajectory of Sri Lanka’s export sector. Sustaining Export Growth Towards National Targets The export performance achieved during the first nine months of 2026 represents continued progress towards strengthening Sri Lanka’s position in international markets and expanding its contribution to the national economy. Sustaining this momentum will require continued efforts to diversify export products and markets, enhance value addition, improve product quality and standards, and strengthen the competitiveness of Sri Lankan exporters. The National Export Development Plan (NEDP) 2026–2030, which targets US$ 36 Bn in annual export earnings by 2030, provides a strategic framework for accelerating export growth through improved trade facilitation, market development, investment promotion, innovation, and enhanced private-sector engagement. Building on the positive results recorded in the first nine months of 2026, continued coordination among government institutions, industry stakeholders, and exporters will be essential to maintaining growth, addressing emerging challenges, and realising Sri Lanka’s long-term export development ambitions. Commenting on the export performance in September 2026, Mr.Mangala Wijesinghe, Chairman and Chief Executive Officer of the Sri Lanka Export Development Board (EDB), stated: “Sri Lanka’s total exports reaching US$ 13.61 Bn during the first nine months of 2026, representing a growth of 5.04% compared with the corresponding period of 2025, reflects the continued resilience and progress of our export sector. Particularly encouraging is the strong performance recorded in September, when total exports increased by 17.23% year-on-year to US$ 1.69 Bn, driven by a significant 21.66% growth in merchandise exports. This performance demonstrates the potential of Sri Lankan exporters to strengthen their presence in international markets despite an increasingly competitive global trading environment. As we move forward, our priority must be to sustain this growth momentum by strengthening the competitiveness of existing export sectors while accelerating the development of new products, services and markets. Enhancing value addition, promoting innovation and technology adoption, diversifying export markets, and integrating more deeply into global value chains will be essential to expanding export earnings and generating greater economic value for the country. The EDB remains committed to working closely with exporters, industry associations and relevant government institutions to address emerging challenges, improve the trade and investment environment, and facilitate greater access to international markets. Through the effective implementation of the National Export Development Plan 2026–2030 and strengthened collaboration among all stakeholders, we aim to build on these positive results, achieve sustainable export growth, and advance Sri Lanka towards its long-term ambition of reaching US$ 36 Bn in annual export earnings by 2030.” Major Exports in September 2026
Products and Services with Positive Growth (Increases) In September 2026, exports of Apparel and Textiles increased by 3.46%, reaching US$ 439.78 Mn compared with US$ 425.07 Mn in September 2025. Apparel exports grew by 3.43% to US$ 408.69 Mn, while textile exports increased by 3.81% to US$ 31.09 Mn. This positive year-on-year growth reflects the resilience of Sri Lanka’s apparel industry amid evolving global market conditions. Exports to the United States, a key destination for Sri Lankan apparel, also increased by 6.33%, contributing positively to the sector’s monthly performance. Rubber and Rubber-Based Products recorded a strong performance in September 2026, with export earnings increasing by 33.68% year-on-year to US$ 99.31 Mn, compared with US$ 74.29 Mn in September 2025. This growth was supported by improved performance across key product segments. Exports of Industrial and Surgical Rubber Gloves increased by 34.38% to US$ 31.70 Mn, while exports of Pneumatic and Retreaded Tyres and Tubes rose by 39.57% to US$ 54.95 Mn. These gains highlight the continued international demand for Sri Lankan rubber-based products and the sector’s competitiveness in global markets. Exports of Spices, Essential Oils and Oleoresins increased significantly by 73.19% in September 2026, reaching US$ 74.73 Mn compared with US$ 43.15 Mn in September 2025. Pepper exports surged by 165.38% to US$ 23.46 Mn, while cinnamon exports increased by 68.27% to US$ 42.59 Mn. Coconut Fibre-based Products also recorded a positive performance, with export earnings increasing by 2.99 % year-on-year. Activated Carbon, a high-value, value-added product derived from coconut shells, recorded a 43.52% year-on-year increase, with export earnings reaching US$ 25.26 Mn in September 2026. This strong performance underscores the growing contribution of diversified, value-added coconut-based products to Sri Lanka’s export earnings, while highlighting the sector’s potential for further value addition, product diversification and expansion in global markets. The Food and Beverages sector recorded a strong year-on-year increase of 27.92% in export earnings, reaching US$ 63.77 Mn in September 2026 compared with US$ 49.85 Mn in September 2025. This positive performance highlights the continued demand for Sri Lankan food and beverage products in international markets and the sector’s potential to further strengthen its contribution to the country’s export earnings. The Electrical and Electronic Components sector recorded significant growth of 88.35% in September 2026, with export earnings reaching US$ 68.54 Mn, compared to the corresponding month of 2025. This notable performance was mainly supported by a 114.62% increase in exports of Insulated Wires and Cables, highlighting Sri Lanka’s expanding participation in global value chains and supply networks. Seafood exports recorded a growth of 4.01% in September 2026, reaching US$ 23.61 Mn compared with US$ 22.7 Mn in September 2025. Frozen fish exports increased by 15.85% to US$ 13.96 Mn, while exports of shrimps rose by 207.27% to US$ 3.38 Mn. On the services export front, Transport and Logistics Services exports are estimated to have reached US$ 167.9 Mn in September 2026, reflecting a 23.32 % year-on-year increase compared with US$ 136.15 Mn in September 2025. This strong growth highlights the sector’s contribution to Sri Lanka’s services export performance and reinforces the country’s potential to strengthen its position as a competitive regional hub for transport, logistics and maritime services in global markets. Products with Negative Growth (Decreases) Tea export earnings declined by 1.38% year-on-year to US$ 135.11 Mn in September 2026, compared with US$ 137.0 Mn in September 2025. The decline was primarily attributable to weaker export performance in key markets, particularly the Middle East, where tea exports decreased by 26.85 % compared to September 2025. Within the region, exports to the United Arab Emirates, Iran, and Iraq recorded notable declines of 42.56%, 34.57%, and 55.73%, respectively, reflecting challenging market conditions affecting Sri Lanka’s tea exports. The Coconut-based Products sector recorded an 8.88% year-on-year decline in export earnings, falling to US$ 111.60 Mn in September 2026 from US$ 122.47 Mn in September 2025. Among the three major sub-categories, Coconut Kernel Products recorded the significant decline, decreasing by 29.15%. Within this category, export earnings from Coconut Oil and Liquid Coconut Milk declined by 19.25% and 26.89%, respectively, contributing significantly to the sector’s overall decline. Meanwhile, exports of Coco Peat, Fibre Pith and Moulded Products decreased by 10.63%, reaching US$ 21.44 Mn in September 2026. Ornamental fish exports declined by 35.15% year-on-year to US$ 1.55 Mn in September 2026, compared with US$ 2.39 Mn in September 2025. This substantial contraction highlights the challenges facing the sector’s monthly export performance. Exports of Non-metallic Mineral Products declined by 3.85% in September 2026 to US$ 10.24 Mn, compared with US$ 10.65 Mn in September 2025. Exports during the period of January – September 2026 Sri Lanka’s export performance remained positive during the January–September 2026 period, with total exports reaching an estimated US$ 13,612.55 Mn, reflecting a 5.04% year-on-year increase compared with US$ 12,959.17 Mn in the corresponding period of 2025. Merchandise exports grew by 5.35% to US$ 10,761.92 Mn, while services exports increased by 3.88% to US$ 2,850.63 Mn. The continued expansion of both merchandise and services exports highlights the resilience of Sri Lanka’s export sector amid evolving global market conditions. While merchandise exports remained the main contributor to overall export growth, the continued increase in services exports underscores their growing role in diversifying the export base and generating foreign exchange earnings. Sustaining this positive momentum will require strengthening export competitiveness, expanding access to international markets, promoting value-added products and services, and broadening the range of export sectors contributing to national economic growth. Products & Services with Positive Growth (Increases) Cumulative export earnings from several key sectors recorded strong growth during January–September 2026. Rubber-based Products, Coconut-based Products, Processed Food & Beverages, Electrical & Electronic Components, and Spices and Concentrates recorded year-on-year increases of 8.44%, 3.68%, 20.9%, 61.05 and 30.53% respectively. These gains highlight the growing contribution of value-added manufacturing and the continued potential for product diversification to strengthen Sri Lanka’s export performance. Export earnings from Coconut-based Products increased by 3.68 % year-on-year to reach US$ 942.5 Mn during the period of January - September 2026, supported by Fibre-based Products (7.42%), and Shell-based Products (45.91%). The strong performance was driven by increased exports of products such as Coconut Husk Chips (334.15%) and Activated Carbon (37.79%), reflecting sustained global demand and enhanced value addition within the sector. The Rubber and Rubber-based Products sector generated export earnings of US$ 773.88 Mn during January–September 2026, recording an 8.44% year-on-year growth. The positive performance was primarily supported by increased exports of Pneumatic and Retreaded Rubber Tyres and Tubes and Industrial and Surgical Gloves, which grew by 7.67% and 7.58%, respectively. Exports of Gaskets, Washers and Seals also recorded strong growth of 27.78%. This performance reflects the resilience and competitiveness of Sri Lanka’s rubber-based manufacturing sector and its continued presence in global markets. Export earnings from the Food and Beverages sector increased by 20.90% year-on-year, reaching US$ 526.31 Mn during January–September 2026. This growth was largely driven by Processed Food exports, which recorded a notable 34.19% increase to reach US$ 243.28 Mn. Exports of non-alcoholic beverages also grew by 46.78%, while animal feed exports increased by 13.69%. These results highlight the growing export potential of Sri Lanka’s value-added food products and the sector’s contribution to overall export performance. Meanwhile, export earnings from Spices, Essential Oils and Oleoresins increased by 30.53%, reaching US$ 430.53 Mn during January–September 2026. This growth was primarily driven by Pepper and Cinnamon, which recorded year-on-year increases of 61.45% and 31.03%, reaching US$ 136.26 Mn and US$ 221.56 Mn, respectively. Exports of Essential Oils and Oleoresins also increased by 22.17% and 30.09%, respectively. The strong performance of these key products reflects continued international demand for Sri Lanka’s spices and their contribution to export growth. Exports of Electrical & Electronic Components recorded exceptional growth during January–September 2026, increasing by 61.05% year-on-year to reach US$ 508.86 Mn. This performance was supported by significant growth in exports of Insulated Wires and Cables (82.59%), Switches, Boards and Panels (31.49%), and Electrical Transformers (33.46%). Exports of Telephone Sets and Audio/Video Equipment and Parts increased by 234.82%, while Boilers, Piston Engines, Pumps and Vacuum Pumps recorded growth of 508.71%. These results highlight the growing competitiveness and export potential of Sri Lanka’s electrical and electronic manufacturing sector. Furthermore, ICT/BPM exports are estimated to have increased by 3.69% year-on-year, reaching US$ 1,240.67 Mn during January–September 2026, compared with US$ 1,196.55 Mn in the corresponding period of 2025. This growth highlights the continued expansion of Sri Lanka’s digital and knowledge-based economy and the sector’s growing contribution to national export earnings, reinforcing its importance as a high-value, services-oriented export sector. Products with Negative Growth (Decreases) Export earnings from the Apparel and Textiles sector declined by 5.68% year-on-year to US$ 3,783.76 Mn during January–September 2026, compared with the corresponding period in 2025. The decline was driven by a 5.36% decrease in apparel exports to US$ 3,513.37 Mn and a 9.66% reduction in textile exports to US$ 270.39 Mn. The sector’s performance was affected by subdued demand in key export markets, particularly the United States and the European Union, which together account for more than half of Sri Lanka’s apparel exports. During the period, exports to the United States, the European Union, and the United Kingdom declined by 3.83%, 5.54%, and 10.41%, respectively, contributing to the overall contraction amid challenging global market conditions. Tea export earnings declined by 6.83% year-on-year to US$ 1,083.58 Mn during January–September 2026, compared with the corresponding period in 2025. The decline was mainly driven by lower earnings from Tea Packets and Bulk Tea, which decreased by 4.42% and 11.13%, respectively. Although exports of Tea Bags and Instant Tea grew by 53.39% and 9.85%, respectively, these increases were insufficient to offset the overall decline. The contraction was further influenced by weaker performance in key export markets, particularly the Middle East, where tea exports fell by 34.22%. Within the region, exports to the United Arab Emirates, Iran, and Iraq declined by 59.66%, 65.80%, and 47.72%, respectively, highlighting the challenges facing Sri Lanka’s tea export sector in these markets. Seafood exports declined by 2.03% year-on-year, generating export earnings of US$ 180.81 Mn during January–September 2026. The contraction was mainly associated with lower exports of Frozen Fish, which declined by 1.88%, and Fresh or Chilled Fish, which decreased by 9.59%. Ornamental Fish exports also fell by 26.71%. Table 1 shows a comparative analysis of export performance for September 2025–2026, along with the cumulative figures for the January–September period. Table 1: Comparison of Product-wise Merchandise Export Performance Sri Lanka’s Export Performance in Major Markets Among the top fifteen export destinations, several key markets, including United States, India, Italy, China, Turkey, Australia, Belgium, Mexico and Japan, recorded positive year-on-year growth both in September 2026 and cumulatively during January-September 2026. This positive performance across multiple key markets reflects sustained export growth and strengthening demand across these destinations. The United States, Sri Lanka’s largest single export destination, accounting for approximately 20.3% of total merchandise exports, recorded strong year-on-year growth of 18.06% in September 2026, with export earnings reaching US$ 281.84 Mn. Cumulative exports to the United States during January-September 2026 also recorded a marginal increase of 0.05%, reaching US$ 2,252.99 Mn compared with the corresponding period in 2025. This performance reinforces the continued importance of the US market to Sri Lanka’s merchandise exports, maintaining its position as the country’s leading export destination. India strengthened its position as Sri Lanka’s second-largest export destination, surpassing the United Kingdom, with cumulative exports increasing by 12.3% to US$ 889.84 Mn during January-September 2026. Exports to India also recorded robust year-on-year growth of 29.65% in September 2026, reaching US$ 113.22 Mn. In contrast, exports to the United Kingdom declined by 3.17% year-on-year to US$ 71.71 Mn in September 2026, while cumulative exports during January-September 2026 decreased by 9.33% to US$ 654.36 Mn. These trends highlight India’s growing importance as a key destination for Sri Lanka’s merchandise exports, alongside the continued significance of the UK market. The United Arab Emirates (UAE) recorded a 17.8% year-on-year decline in export earnings in September 2026, amounting to US$ 33.66 Mn. Cumulative exports to the UAE during January-September 2026 also declined by 10.5% compared with the corresponding period in 2025, reaching US$ 232.06 Mn. Despite this contraction, the UAE remained an important destination for Sri Lanka’s merchandise exports, highlighting its continued relevance in the country’s export market portfolio. Turkey recorded strong export growth of 64.22% in September 2026, with export earnings reaching US$ 30.71 Mn. Cumulative exports during January–September 2026 also increased substantially by 94.01% year-on-year, reaching US$ 218.24 Mn. This strong performance reflects improved market penetration, and growing demand for Sri Lankan products in the Turkey. Notably, tea exports to Turkey recorded strong year-on-year growth of 82.48% in September 2026, while cumulative tea exports during January–September 2026 increased by 126.51% compared with the corresponding period in 2025. This substantial growth highlights the expanding market for Sri Lankan tea in Turkey and presents opportunities to further strengthen market presence and expand export earnings. China also recorded strong export growth of 9.36% in September 2026, with export earnings reaching US$ 25.48 Mn. Cumulative exports to China during January–September 2026 also increased substantially by 16.46% year-on-year, reaching US$ 234.39 Mn. The strong performance was supported by notable growth in key export products, particularly activated carbon, which recorded year-on-year increases of 55.56% in September 2026 and 78.33% during January–September 2026, compared with the corresponding periods in 2025. Table 2 shows a comparative analysis of merchandise export performance across the top 15 export markets for September 2025 & 2026, along with the cumulative figures for the January- September period of 2025 & 2026. Table 2: Comparison of Merchandise Export Performance of Top 15 Export Destinations Exports to FTA Partners (India & Pakistan) September 2026 Exports to India and Pakistan collectively accounted for 9.04% of Sri Lanka’s total merchandise exports in September 2026, with combined export earnings reaching US$ 125.14 Mn, reflecting a 33.85% year-on-year increase. Exports to India grew by 29.65% to US$ 113.22 Mn, primarily driven by increased exports of pepper. Meanwhile, exports to Pakistan recorded a substantial year-on-year increase of 93.51%, reaching US$ 11.92 Mn. These gains highlight the positive export performance across both South Asian markets during the month. January – September 2026 During January–September 2026, export earnings to India increased by 12.3% year-on-year, reaching US$ 889.84 Mn. This growth was primarily driven by increased exports of pepper, boilers, piston engines, pumps and vacuum pumps, coconut shell charcoal, animal feed, and base metal products. Exports to Pakistan also recorded strong year-on-year growth of 33.59%, reaching US$ 74.73 Mn during the period. This performance was supported by increased exports of other textile articles, desiccated coconut, tea, and other articles of stone, highlighting the growing opportunities for Sri Lankan products in the Pakistani market. Sri Lanka’s Export Performance in Regions Table 3 shows the comparison of region wise exports for September 2025 & 2026, along with the cumulative figures for the January–September period of 2025 & 2026. Table 3: Comparison of Region wise Merchandise Export Performance Exports to the European Union (EU), which accounted for approximately 20.12% of Sri Lanka’s total merchandise exports, recorded a modest year-on-year increase of 1.92% in September 2026 compared with the corresponding month in 2025. However, cumulative exports to the EU during January-September 2026 recorded a marginal decline of 0.15% year-on-year. These relatively modest changes indicate a broadly stable export performance in the EU market, with monthly growth partially offset by the slight contraction in cumulative export earnings. Among the top five EU export markets, Italy remained the leading destination, with export earnings reaching US$ 514.28 Mn, reflecting a year-on-year increase of 1.48% during January–September 2026. Exports to Germany amounted to US$ 513.08 Mn, recording a decline of 4.27%, while exports to the Netherlands decreased by 5.35% to US$ 328.12 Mn. Exports to France also declined by 6.54%, reaching US$ 198.77 Mn. In contrast, exports to Belgium increased by 3.16% to US$ 193.42 Mn during the same period, reflecting varied export performance across the major EU markets. Sources: Data were obtained from the Central Bank of Sri Lanka (CBSL) and Sri Lanka Customs. Export figures of Services, Gems & Jewellery, and Petroleum Products for September 2026 were estimated by the EDB.