April, 29, 2021

Sri Lanka’s Export Performance January - March 2021
Sri Lanka surpassed $ 1 billion exports in March 2021 after a lapse of six months period. As per the Customs statistics, earnings from merchandise exports recorded double digit growth of 62.47% in March 2021 on y-o-y comparison – the March figure being US$ 1,066.1 Mn.
Earnings from merchandise exports increased by 11.51% in first quarter 2021 to US$ 2,954.53 Mn compared to first quarter 2020.
This growth could be attributed to the gradual lifting of Covid 19 restrictions imposed within the country and globally.
Export Development Board (EDB) Chairman Suresh De Mel said; “Sri Lanka’s exports show a remarkable rise despite the current pandemic situation across the World”.
Graph I: Monthly Export Performance 2019, 2020 & Jan-Mar 2021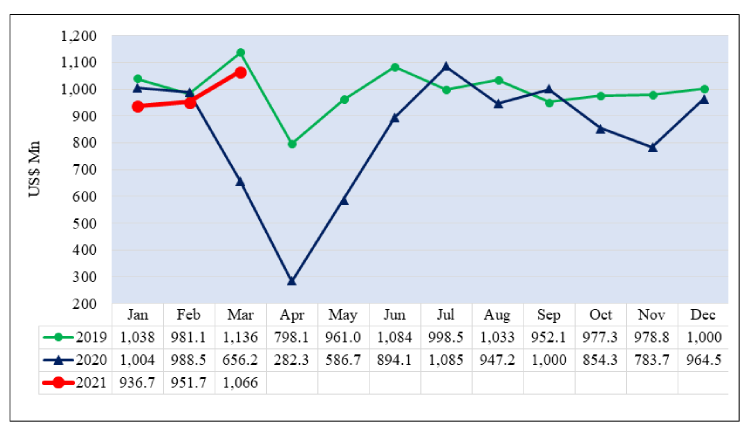
Sources: Central Bank of Sri Lanka, Sri Lanka Customs & Sri Lanka Export Development Board
Export Performance of Major Sectors
As shown in the table below, earnings from the export of major product sectors such as Apparel, Tea, Rubber based Products, Coconut based, Spices and Electrical & Electronic Components were increased both in the month of March 2021 and during the first quarter of 2021 compared previous year.
Table 1: Merchandise Export Performance
Values in US$ Mns
| Exports of Goods | Jan-Mar
2020 |
Jan-Mar 2021 | % Growth | Mar
2020 |
Mar
2021 |
% Growth |
| Apparel | 1,250.86 | 1,328.26 | 6.19 | 312.10 | 465.35 | 49.10 |
| Tea | 270.07 | 338.12 | 25.20 | 62.52 | 124.61 | 99.31 |
| Rubber-based | 203.34 | 268.54 | 32.06 | 55.80 | 100.69 | 80.45 |
| Coconut-based | 136.93 | 194.69 | 42.18 | 38.24 | 80.14 | 109.57 |
| Diamond, Gems & Jewelry | 53.38 | 64.90 | 21.58 | 7.02 | 20.04 | 185.47 |
| Electronics & Electronic Components | 81.95 | 102.04 | 24.51 | 20.70 | 37.90 | 83.09 |
| Spices and Essential Oils | 51.40 | 114.30 | 122.37 | 13.05 | 38.71 | 196.63 |
| Food & Beverages | 86.97 | 92.83 | -15.62 | 29.45 | 32.18 | 9.27 |
| Seafood | 57.00 | 56.36 | -1.12 | 12.76 | 25.41 | 99.14 |
| Ornamental Fish | 3.69 | 3.78 | 2.44 | 0.98 | 1.87 | 90.82 |
| Vegetables | 6.68 | 5.97 | -10.63 | 1.76 | 2.69 | 52.84 |
| Fruits | 9.22 | 9.10 | -1.30 | 2.29 | 3.61 | 57.64 |
| Other Export Crops | 23.03 | 14.16 | -38.51 | 6.20 | 7.56 | 21.94 |
| Flowers & Foliage | 3.95 | 3.72 | -5.82 | 1.41 | 1.57 | 11.35 |
| Boat Building | 0.91 | 0.64 | -29.67 | 0.39 | 0.33 | -15.38 |
| Petroleum Products | 105.73 | 9.95 | -90.59 | 28.20 | 8.80 | -68.79 |
| Others | 304.49 | 347.17 | 14.02 | 63.33 | 114.64 | 81.02 |
| Total Merchandize Exports | 2,649.60 | 2,954.53 | 11.51 | 656.20 | 1,066.10 | 62.47 |
Sources: Sri Lanka Customs / Sri Lanka Export Development Board
Export earnings from Spices and Essential Oils in March 2021, increased significantly compared to March 2020 - growth is mainly due to increased exports of cinnamon (1425.9%), pepper (140.58%) and cloves (226%). It is a significant quarter wise increase of 122.37 % compared to year 2020 – an increase beyond 1st quarter 2019.
Both export earnings and volume of tea increased y.o.y. in March 2021 by 99.33% and 86.69% respectively. Tea exports of US$ 124.61 Mn is 12% of total merchandise exports. First three months comparison records at 25.2 % increase - The higher performance is due to demand growth of UAE, China and Libiyan markets.
Earnings from all the major categories of Coconut based products increased by 109.57% in March 2021 compared with March 2020 due to the improved performance in export of Coconut Oil, Liquid Coconut Milk, Cocopeat & Activated Carbon. Similarly, earnings from the export of all the major categories of Coconut based products increased by 42.18% during the first quarter of 2021 compared to the first quarter of 2020.
Export earnings from Rubber & Rubber finished products increased by 80.45 % y-o-y to US$ 35.06 Mn in March 2021 due to the better performance of exports of Industrial & Surgical Gloves of Rubber (160.09%) and Pneumatic & Retreated Rubber Tyres & Tubes (58.99%). In parallel Export earnings from Rubber & Rubber finished products increased by 32.06% during the first quarter of 2021 compared to the first quarter 2020.
Meanwhile earnings from export of Electrical and Electronic Components (EEC) increased by 83.09% to US$ 37.9 Mn in March 2021 in comparison to March 2020. Also, earnings from export of EEC increased by 24.51% to US$ 102.04 Mn in the first quarter of 2021 compared to the first quarter of 2020. Export of Insulated wires increased by 121.05 % in y-o-y to US$ 6.72 Mn in March 2021 also increased by 21.13 % during the period of January to March 2021 to US$ 18.00 Mn compared with the corresponding period of previous year.
Sri Lanka’s Trade Performance in Major Markets
The single largest export destination of United States of America recorded US$ 715.4 Mn worth of exports in first quarter 2021– a marginal increase of 0.94 % in comparison to US$ 708.76 Mn recorded in first quarter 2020.
Specially, Exports to China and Netherlands increased y-o-y by about 150% in March 2021 while the quarterly increase of the same markets improved by 62% and 69.84% respectively.
Strong performance made by Apparel and Liquid Coconut Milk exports has resulted to the increased Exports to Netherlands and better performance of export of Bulk tea, Mineral Sands, Activated Carbon and Cocopeat has resulted increased exports to China.
However, exports to United Kingdom recorded decrease of 5.39% to US$ 225.9 Mn in first quarter 2021 compared to first quarter 2020.
On an region wise comparison exports to all other regions increased except ASEAN during the first quarter 2021 compared to the first quarter 2020.
Top 10 Export Destinations
| Country | Jan-Mar
2020 |
Jan-Mar 2021 | % Growth | Mar
2020 |
Mar
2021 |
% Growth | |
| 1 | United States | 708.76 | 715.40 | 0.94 | 180.86 | 243.61 | 34.70 |
| 2 | United Kingdom | 238.76 | 225.90 | -5.39 | 58.93 | 84.53 | 43.44 |
| 3 | India | 173.32 | 193.44 | 11.61 | 36.72 | 77.21 | 110.27 |
| 4 | Germany | 142.25 | 180.17 | 26.66 | 39.47 | 67.47 | 70.94 |
| 5 | Italy | 112.56 | 152.05 | 35.08 | 26.88 | 54.61 | 103.16 |
| 6 | Belgium | 72.85 | 83.22 | 14.23 | 19.59 | 30.51 | 55.74 |
| 7 | Netherlands | 62.87 | 106.78 | 69.84 | 16.54 | 41.73 | 152.30 |
| 8 | China | 47.68 | 77.24 | 62.00 | 11.83 | 29.53 | 149.62 |
| 9 | Canada | 54.81 | 72.14 | 31.62 | 16.54 | 24.29 | 46.86 |
| 10 | Turkey | 43.56 | 54.95 | 26.15 | 10.80 | 16.93 | 56.76 |
| Other Markets | 992.18 | 1,093.24 | 10.19 | 238.04 | 395.68 | 66.22 | |
| Total Merchandise Exports | 2,649.60 | 2,954.53 | 11.51 | 656.20 | 1066.10 | 62.47 |
Sources: Sri Lanka Customs & Sri Lanka Export Development Board
Export Regions
| Region | Jan-Mar
2020 |
Jan-Mar 2021 | % Growth | Mar
2020 |
Mar
2021 |
% Growth |
| EU excluding UK | 559.33 | 733.51 | 31.14 | 147.88 | 268.94 | 81.86 |
| United States | 708.76 | 715.40 | 0.94 | 180.86 | 243.61 | 34.70 |
| South Asia | 261.88 | 282.69 | 7.95 | 55.94 | 114.88 | 105.36 |
| ASEAN Countries | 88.33 | 63.39 | -28.24 | 19.78 | 25.94 | 31.14 |
| CIS Countries | 60.05 | 66.53 | 10.79 | 12.89 | 22.14 | 71.76 |
| African Countries | 56.79 | 74.37 | 30.96 | 13.57 | 31.46 | 131.83 |
| Middle East Countries (Excl. Cyprus & Egypt) | 185.12 | 194.77 | 5.21 | 51.55 | 77.95 | 51.21 |
| Others | 729.34 | 823.87 | 12.96 | 173.73 | 281.18 | 61.85 |
| Total Merchandise Exports | 2,649.60 | 2,954.53 | 11.51 | 656.20 | 1,066.10 | 62.47 |
Sources: Sri Lanka Customs & Sri Lanka Export Development Board
Export of Services
The services exports estimated by EDB which includes ICT/BPM, Construction, Financial services and Transport & Logistics show exports of US $ 1,194.3 Mn for the first quarter of 2021 compared to US$ 993 Mn recorded in the corresponding period of 2020. Estimated service exports increased by 20.27% in the first quarter 2021 compared to the first quarter of 2020.
Video Story