March, 9, 2021
Bandula Gunawardana, Minister of Trade urged the whole stakeholders to actively engage in assisting all exporters of the country in every possible manner during this turbulent period enabling exporters to strengthen our economy.
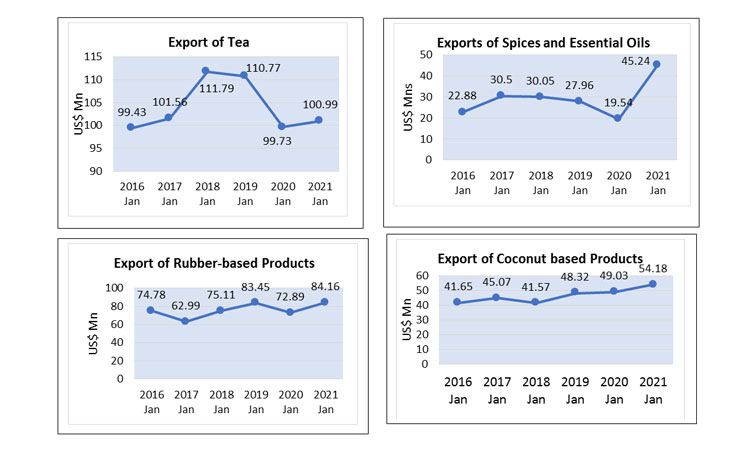
After observing the export performance of the month of January, he further stated that it is encouraging to see important export sectors such as Tea, Spices & essential Oils, Coconut and Rubber-based products are doing well despite the global recession created by the pandemic.
Export Performance in January 2021
As per the Customs statistics, earnings from merchandise exports recorded a negative growth of 9.64% in January 2021 with US$ 908.07 Mn compared to US$ 1,004.9 Mn recorded in January 2020. The exports which started to grow since last July continued the positive performance till September 2020 with minor contractions with reduced figures from October to December 2020. However, growth in exports in January 2021 is still modest compared to last five years.
Export Performance of Major Sectors
Export earnings from Apparel & Textiles declined by 10.76 % to US$ 421.28 Mn during the month of January 2021 compared with US$ 472.07 Mn recorded in January 2020. In parallel, 6.94 % decline recorded in January 2021 in comparison to December 2020. Despite the decline in the sector, earnings from exports of other textiles increased by 25.21% in January 2021 in comparison to January 2020.
Export earnings from tea in January 2021 which made up 12% of merchandise exports, increased by 1.25% y-o-y to US$ 100.99 Mn. Although export of bulk tea increased by 15.86% in January 2021 compared to January 2020, export of tea packets and tea bags were declined by 12.31% and 15.86% respectively. Moreover, 10.6 % decline recorded in tea exports in January 2021 compared to December 2020.
In addition, Export earnings from Rubber & Rubber finished products have increased by 5.46 % y-o-y to US$ 84.16 Mn in January 2020 due to the better performance in exports of Pneumatic & Retreated Rubber Tyres & Tubes (10.97%), Industrial & Surgical Gloves of Rubber (40.43%). and Hygienic or Pharmaceutical Articles (133.33%). However, exports of Rubber Plates, Sheets Rods of Vulcanized or Unhardened Rubber and Gaskets, Washers, Seals etc. of Hard Rubber and have decreased by 17.5 % and 28.37% respectively in January 2021 in comparison to January 2020.
Earnings from all the major categories of Coconut based products increased in January 2021 compared with January 2020. Earnings from Coconut Milk Powder, Coconut Cream, Liquid Coconut Milk and Coconut Flour categorized under the Coconut Kernel Products increased by 64.85%, 8.19%, 38.97% and 88.24% respectively in January 2021 compared with January 2020. Being the largest contributor to Coconut based sector, Coco Peat, Fiber Pith & Moulded products which categorized under the Coconut fibre products increased by 27.65 % to US$ 11.82 Mn in January 2021 in comparison to January 2020. Earnings from Activated Carbon, which categorised under the Coconut shell products increased by 23.99 % in January 2021 compared to January 2020.
Export earnings from Spices and Essential Oils have increased by 115.96% to US$ 42.22 Mn in January 2021 compared with the value of US$ 19.55 Mn recorded in January 2020 due to the better performance recorded in exports of cinnamon (82.28%), pepper (432.93%), cloves (184.73%), nutmeg & mace (50.62%), essential oils (142.22%).
In addition, earnings from export of Electrical and Electronic Components (EEC) increased by 12.86% to US$ 31.85 Mn in January 2021 in comparison to January 2020 due to the better performance recorded in other electrical and electronic products (23.65%).
Table 1 : Merchandise Export Performance
Values in US$ Mns
| Exports of Goods | Jan 2020 | Jan 2021 | % Growth |
| Apparel | 472.07 | 421.28 | -10.76 |
| Tea | 99.73 | 100.99 | 1.26 |
| Rubber-based products | 72.89 | 84.16 | 15.46 |
| Coconut-based products | 49.03 | 54.18 | 10.50 |
| Diamond, Gems & Jewelry | 28.20 | 28.93 | 2.59 |
| Electronics & Electronic Components | 28.23 | 31.85 | 12.82 |
| Spices and Essential Oils | 19.54 | 45.24 | 116.17 |
| Food & Beverages | 27.00 | 31.35 | 16.11 |
| Seafood | 23.66 | 16.91 | -28.53 |
| Ornamental Fish | 1.45 | 0.88 | -39.31 |
| Vegetables | 2.63 | 1.70 | -35.36 |
| Fruits | 3.84 | 2.86 | -25.52 |
| Other Export Crops | 8.19 | 2.47 | -69.84 |
| Flowers & Foliage | 1.05 | 1.09 | 3.81 |
| Boat Building | 0.40 | 0.05 | -87.50 |
| Petroleum Products | 35.64 | 0.46 | -98.71 |
| Others | 131.35 | 83.67 | -36.30 |
| Total Merchandize Exports | 1004.9 | 908.07 | -9.64 |
Sources: Sri Lanka Customs / Sri Lanka Export Development Board
Sri Lanka’s Trade Performance in Major Markets
Being the largest single export destination, United States of America has absorbed US$ 233.53 Mn worth of exports in January 2021 recording a decline of 12.73 % in comparison to US$ 267.61 Mn absorbed in January 2020.
Exports to United Kingdom as the second largest trading partner recorded a decrease of 27.93% to US$ 61.49 Mn in January 2021 compared with January 2020. The United Kingdom left the European Union on 31st January 2020 and the transition period ended up on 31st December 2020. During this transition period, UK applied the same import tariffs it used to apply as a member of the EU. In the meantime, following BREXIT the UK introduced a new tariff regime, namely, UK Global Tariff (UKGT) with effect from 01st of January 2021.
Most of the drop in exports to UK was due to Brexit, but January 2021 also saw the re-imposition of lockdown in the UK, which undoubtedly had some impact.
Meanwhile, increases in exports were recorded in Germany (3.01%), Netherlands (53.5%), China (14.18%), Canada (39.6%) and Turkey (47.85%) during the month of January 2021 compared to January 2020.
Table 2: Sri Lanka’s Top 10 Export Destinations
Values in US$ Mns
| Country | Jan 2020 | Jan 2021 | % Growth | |
| 1 | United States | 267.61 | 233.53 | -12.73 |
| 2 | United Kingdom | 85.31 | 61.49 | -27.92 |
| 3 | India | 63.21 | 55.65 | -11.96 |
| 4 | Germany | 51.89 | 53.45 | 3.01 |
| 5 | Italy | 45.46 | 53.04 | 16.67 |
| 6 | Belgium | 29.61 | 23.70 | -19.96 |
| 7 | Netherlands | 22.71 | 34.86 | 53.50 |
| 8 | China | 19.25 | 21.98 | 14.18 |
| 9 | Canada | 17.07 | 23.83 | 39.60 |
| 10 | Turkey | 15.13 | 22.37 | 47.85 |
| Other Markets | 387.65 | 324.16 | -16.38 | |
| Total | 1004.9 | 908.07 | -9.64 |
Sources: Sri Lanka Customs / Sri Lanka Export Development Board
Table 3: Sri Lanka’s Export Regions
Values in US$ Mns
| Region | Jan 2020 | Jan 2021 | % Growth |
| European Union | 298.01
(212.70*) |
234.03 |
10.03 |
| United States | 267.61 | 233.53 | -12.73 |
| South Asia | 100.02 | 81.58 | -18.44 |
| Asean Countries | 36.66 | 19.63 | -46.45 |
| CIS Countries | 24.89 | 21.04 | -15.47 |
| African Countries | 18.75 | 17.95 | -4.27 |
| Middle East Countries (Excl. Cyprus & Egypt) | 60.45 | 60.90 | 0.74 |
| Others | 198.51 | 239.41 | 20.60 |
| Total Merchandise Exports | 1004.9** | 908.07 | -9.64 |
*excluding UK ** including UK
Sources: Sri Lanka Customs / Sri Lanka Export Development Board
Export of Services
The services exports estimated by EDB which includes ICT/BPM, Construction, Financial services and Transport & Logistics show exports of US $ 353.98 Mn for the month of January 2021 compared to US$ 331 Mn recorded in January 2020. Estimated service exports increased by 6.94 % in January 2021 in comparison January 2020.
Video Story