October, 31, 2017
Provincial Gross Domestic Product (PGDP) for 2016 has been computed by the Statistics Department of Central Bank of Sri Lanka (CBSL), by disaggregating the nominal Gross Domestic Product (GDP) compiled by the Department of Census and Statistics (DCS). In the estimation of PGDP for the provinces, the value of each line item in GDP is apportioned using relevant indicators at provincial level.
In nominal terms the national GDP for 2016 was Rs. 11,839 billion recording a growth of 8.11 per cent and a per capita income of Rs. 558,363 (US$ 3,835). The overall performance of PGDP in 2016 follows the general trend of GDP of the country and developments in economic activities. The subdued performance of the agriculture activities contributed to the slower growth in provinces where agriculture remains a main economic activity. Even though the Western province continues to drive overall economic progress occupying 39.7 per cent of GDP, contributions from other provinces gradually increase with the expansion of regional economic bases.
The disaggregation of national GDP at current market prices across provinces is given in Table 1. While Western province retained the highest value of Rs. 4,697 billion, the second and third largest values of Rs. 1,262 billion and Rs. 1,248 billion were recorded from North Western and Central provinces. The Southern province retained the fourth position contributing Rs. 1,190 billion to national GDP in 2016.

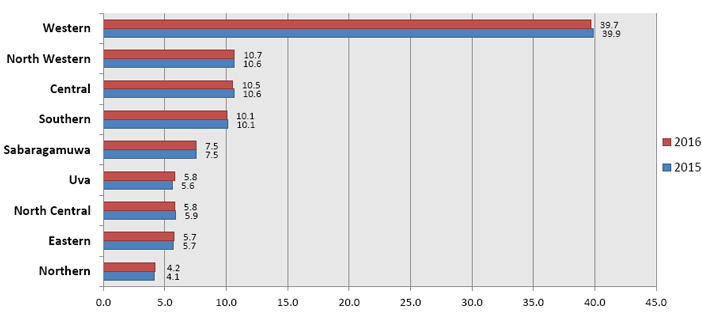
The provincial shares as a percentage of the national GDP are given in Chart 1. Accordingly, the major contribution of 10 per cent or more were reported from Western, North Western, Central and Southern provinces.

Continuing the trend observed in recent years, the GDP share of the Western province declined in 2016 contributing to reduce disparities among provinces. However, the Western province remained the frontrunner in the economy providing the highest contribution of 39.7 per cent to GDP. The North Western province accounted for the second highest contribution of 10.7 per cent in 2016, compared to 10.6 per cent in 2015. The third highest contribution of 10.5 per cent was observed from the Central province in 2016, which was a marginal decline from 10.6 per cent recorded in 2015. Contributions from the Uva and the Northern provinces increased marginally to 5.8 per cent and 4.2 per cent in 2016 compared to 5.6 per cent and 4.1 per cent in 2015, respectively. Except for the North Central province, the contributions to GDP from the other three provinces, namely Southern, Sabaragamuwa and Eastern, remained unchanged at 10.1 per cent, 7.5 per cent and 5.7 per cent respectively, in 2016. The share of the North Central province to overall GDP was 5.8 per cent in 2016 from 5.9 per cent in 2015 mainly due to subdued performance in agriculture activities.
All provinces recorded positive nominal growth rates (Table 2) in 2016, with the Uva province recording the highest growth rate of 12.4 per cent in nominal terms. The second and the third highest growth rates of 9.5 per cent and 8.9 per cent were recorded from the Northern and the Eastern provinces respectively. The North Western and the Sabaragamuwa provinces also recorded nominal growth rates surpassing the national nominal growth rate of 8.1 per cent.

The contributions of the economic activities to the province wise GDP are given in Table 3. Though considerable variations can be observed in the structure across the provinces, the compositions remained approximately unchanged within the province during the two years in comparison.

The agriculture sector accounted for 2.1 per cent of the GDP in the Western province in 2016, whereas its contribution to provincial GDP ranged from 7.6 to 13.5 per cent in the other provinces. In comparison to 2015, the contribution of the agriculture activities to the GDP marginally increased in the Northern province, while declines were recorded in all other provinces in 2016.
Except for the Central, the North Western and the Western provinces, contribution from industry activities to PGDP increased in all other provinces. In 2016, the largest contribution to PGDP from industry activities was recorded from the Western province while the lowest share was reported from the Southern province.
The Services activities play a major role in all provinces with contributions between 51.1 per cent and 61.6 per cent of the PGDP in 2016. However, when compared to 2015, the contribution from the Services activities increased in the North Central, the North Western and the Western provinces, but declined in all other provinces during 2016.
The nominal provincial GDP per capita are given in Table 4.

The per capita income increased in all provinces while only that of the Western province exceeded the national value in both years. The ratio between provincial per capita income and the national per capita income is also given in Table 4 and as it reflects the ratios remained unchanged both in 2015 and 2016.
Video Story