April, 23, 2026
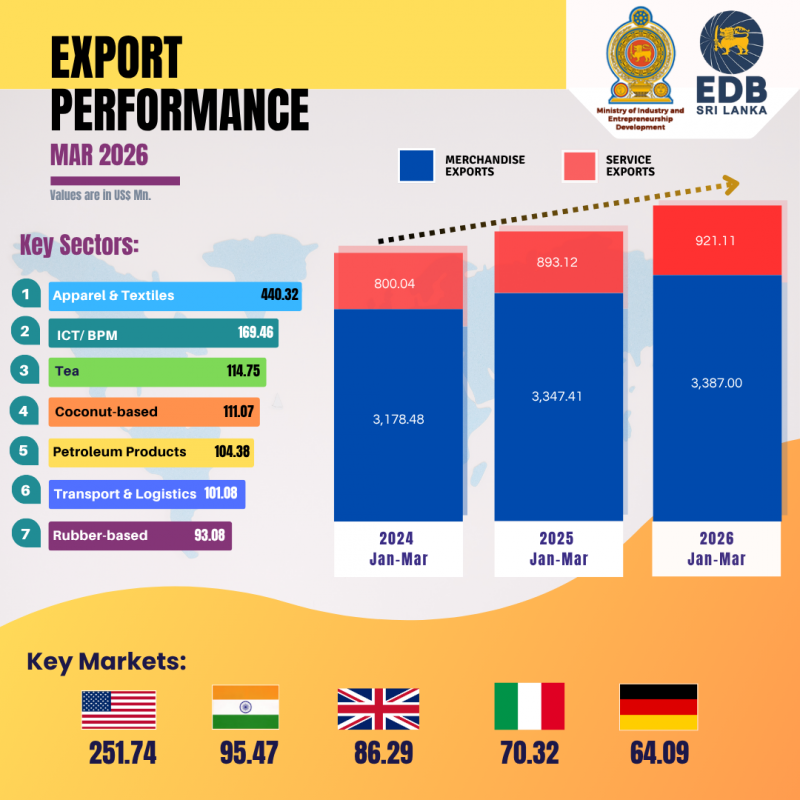
Sri Lanka’s total exports, including both merchandise and services, reached US$ 1,467.31 million in March 2026, reflecting a year-on-year decline of 5.2 % compared to March 2025. However, on a month-on-month basis, exports increased by 9.0% compared to February 2026 (US$ 1,346.2 million), indicating a recovery in export momentum during the month.
According to provisional data from Sri Lanka Customs, along with estimated figures for Gems & Jewellery and Petroleum Products, merchandise exports for March 2026 decreased by 4.94% to US$ 1,180.39 million.
Earnings from services exports were estimated at US$ 286.92 million in March 2026. While this represents a moderate decline of 6.26% compared to March 2025, the services sector continues to demonstrate its growing importance to Sri Lanka’s export portfolio.
On a cumulative basis, total exports for the period January to March 2026 are estimated at US$ 4,308.11 million, recording a growth of 1.59 % over the corresponding period in 2025.
Overall, the positive performance recorded during the first quarter underscores the resilience of Sri Lanka’s external sector. Despite the temporary setback in March, sustained export earnings supported by stable merchandise trade and the increasing contribution of services signal a steady recovery trajectory for 2026.
Commenting on this achievement, Mangala Wijesinghe, Chairman and Chief Executive Officer of the Sri Lanka Export Development Board (EDB), stated:
“While Sri Lanka’s export earnings experienced a temporary moderation in March 2026, reaching US$ 1,467.31 million, the overall performance for the first quarter reflects continued resilience and stability in the export sector.
The cumulative growth recorded during January to March 2026 demonstrates the sector’s ability to navigate evolving global market conditions. This is supported by sustained demand in key export categories, the gradual strengthening of services exports, and ongoing export promotion and market diversification efforts.
Looking ahead, a series of key policy decisions to be taken by the Export Development Council of Ministers (EDCM) will further strengthen the export ecosystem. These include measures to enhance trade facilitation, streamline regulatory processes, support market diversification, and improve access to finance for exporters.
With these strategic interventions, alongside the continued implementation of the National Export Development Plan, Sri Lanka is well-positioned to sustain export growth momentum and achieve its annual export targets in 2026.”
Further analysis indicates that cumulative merchandise export earnings amounted to US$ 3,387.0 million during January–March 2026, reflecting a 1.18 % increase compared to the corresponding period in 2025.
Meanwhile, services exports maintained a strong upward trajectory, recording an estimated 3.13 % growth during the same period, reaching US$ 921.11 million.
This robust expansion highlights the increasing importance of Sri Lanka’s knowledge-based economy and its growing contribution to national export earnings. The services sector,comprising ICT/BPM, Construction, Financial Services, and Transport & Logistics, continues to play a pivotal role in diversifying the country’s export base while generating high-value employment opportunities across the economy.
Major Exports in March 2026
Coconut-based products recorded a strong performance in March 2026, with export earnings increasing by 9.64 % year-on-year. Within the sector, Coconut Fibre Products expanded by 12.59 %, while Coconut Shell Products surged by 44.31%, reflecting robust global demand and increased value addition.
Notably, among coconut shell-based exports, Activated Carbon, a key value-added product registered a significant increase of 36.46%, reaching US$ 23.43 million. This underscores the sector’s growing contribution to Sri Lanka’s export earnings through higher-value product segments.
The Food & Beverages sector also demonstrated notable growth, recording an 18.51% year-on-year increase to reach US$ 65.75 million. This expansion was largely driven by processed food exports, which grew by 20.24%, indicating rising demand for value-added food products in international markets.
Seafood exports recorded a significant increase of 31.92% year-on-year, reaching US$ 22.4 million in March 2026. This growth was driven by strong performance in key product categories, particularly frozen fish, which increased by 33.36%, and shrimp exports, which surged by 111.76%.
Export earnings from Electrical and Electronic Components showed remarkable growth, increasing by 31.83% to US$ 50.78 million. This performance was supported by strong gains in Insulated Wires and Cables and Electrical Transformers, which grew by 54.79% and 33.94%, respectively, compared to March 2025.
Meanwhile, the Diamonds, Gems & Jewellery sector is estimated to have recorded a substantial increase of 26.56%, reaching US$ 33.94 million in March 2026.
On the services, ICT/BPM services are estimated to have achieved steady growth, reaching US$ 169.46 million, while Financial Services expanded significantly by 74.53% to US$ 6.82 million. This continued upward trend highlights the resilience and expanding role of Sri Lanka’s knowledge-based and services-driven economy, further strengthening its contribution to overall export performance.
Products with Negative Growth (Decreases)
Export earnings from Apparel & Textiles declined by 11.22% year-on-year to US$ 440.32 million in March 2026. This downturn was primarily driven by a 12.78% reduction in shipments to the United States, alongside a 2.01% contraction in exports to the European Union. Exports to the United Kingdom also recorded a notable decline of 15.7%, further contributing to the overall decrease in the sector’s performance.
Tea exports declined by 17.34% year-on-year to US$ 114.75 million in March 2026, primarily due to reduced earnings from Bulk Tea (-29.2%) and Tea Packets (-9.79%). Export volumes also contracted by 15.8%, reflecting weakened demand in key markets. Notably, exports to Iraq, Russia, and the UAE declined significantly by 37.66%, 36.36%, and 92.64%, respectively, exerting substantial downward pressure on overall sector performance.
Export earnings from Rubber and Rubber-Based Products declined marginally by 0.64% year-on-year to US$ 92.48 million in March 2026, primarily due to contractions in key product segments. Notably, exports of Industrial and Surgical Rubber Gloves decreased by 11.09%, exerting downward pressure on overall sector performance.
Exports of Spices and Essential Oils declined by 14.56% to US$ 35.97 million during the period, primarily due to weaker performance in key product categories. Notably, pepper exports fell sharply by 55.12%, while cloves exports recorded a significant decline of 77.19%, contributing to the overall downturn in the sector.
Similarly, ornamental fish exports also registered a decline of 13.29%, falling to US$ 1.5 million in March 2026.
Exports during the period of January – March 2026
Cumulative total exports, including both merchandise and services, are estimated at US$ 4,308.11 million for the period January–March 2026, reflecting a growth of 1.59 % compared to the same period in 2025.
Merchandise exports during the first quarter of 2026 are estimated to have increased by 1.18 % to US$ 3,387.0 million, based on provisional data from Sri Lanka Customs together with estimated figures for Gems & Jewellery and Petroleum Products.
Meanwhile, earnings from services exports are estimated to have grown significantly by 3.13 % to US$ 921.11 million compared to the corresponding period in 2025.
Earnings from Coconut-based products, Processed Food and Beverages, and Electrical & Electronic Components increased by 20.85%, 26.05%, and 44.18%, respectively, during the first quarter of 2026 compared to the corresponding period in 2025.
Export earnings from Coconut and Coconut-based products rose significantly by 20.76 % to US$ 314.09 million during January–March 2026 compared to the same period last year. This performance was supported by growth across all major coconut product categories, including Coconut Kernel products (21.05 %), Fibre products (0.04%), and Shell products (52.68%).
The sector’s strong performance was primarily driven by increased export earnings from Coconut Oil (34.97%), Desiccated Coconut (35.07%), Coconut Cream (37.27%), Liquid Coconut Milk (12.63%), and Activated Carbon (46.8%), reflecting sustained global demand and continued value addition within the industry.
Export earnings from Food & Beverages increased by 26.05% year-on-year to US$ 174.5 million during the period January to March 2026, supported by strong performance in processed food exports, which grew by 35.85% to reach US$ 78.44 million.
Meanwhile, earnings from exports of Electrical and Electronic Components (EEC) increased by 44.18% to US$ 142.02 million during January–March 2026 compared to the corresponding period in 2025. This growth was driven by strong performance across key product categories, including Electrical Transformers (+41.73%), Insulated Wires and Cables (+35.9%), and Switches, Boards & Panels (+22.22%).
In addition, exports of Boilers and piston engines also contributed to the upward trend, reaching US$ 16.28 million, reflecting a notable increase during the first quarter of 2026.
Further, export earnings from Seafood increased by 30.93% to US$ 63.16 million during January–March 2026 compared to the same period in 2025. This growth was driven by strong performance in key product categories, including frozen fish (+17.56%) and fresh fish (+106.27%), reflecting improved export volumes and stronger market demand.
Furthermore, the estimated value of ICT exports is expected to increase by 31.15 % to US$ 468.72 Mn during the period of January to March 2026 when compared to the corresponding period of 2025.
Products with Negative Growth (Decreases)
Export earnings from Apparel & Textiles declined by 8.06% to US$ 1,271.98 million during the January–March 2026 period compared to the corresponding period in 2025. This contraction was largely driven by weaker demand in key export markets, particularly the United States and the European Union, which together account for over 50% of total market share. Exports to the United States declined by 6.37%, while shipments to the European Union fell by 7.28%. In addition, exports to the United Kingdom also decreased by 7.93%, further contributing to the overall sectoral downturn.
Earnings from tea exports decreased year-on-year by 5.22% to US$ 351.58 million during January–March 2026. This decline was mainly driven by weaker performance in key product categories, with Bulk Tea exports falling by 9.3% and Tea Packets decreasing by 4.98%, compared to the corresponding period in 2025.
Export earnings from Rubber and Rubber Finished Products recorded a marginal decline of 0.96% to US$ 248.86 million during January–March 2026 compared to the same period in 2025. This slight decrease was primarily attributed to reduced exports of Industrial and Surgical Rubber Gloves, which fell by 9.2%, exerting downward pressure on overall sector performance.
In addition, export earnings from Spices and Essential Oils recorded a marginal year-on-year decline of 5.38%, to US$ 112.63 million during January–March 2026. This decrease was mainly driven by the weak performance of key product categories, particularly Pepper (-45.9%) and Cloves (-77.36%), which significantly impacted overall sector earnings.
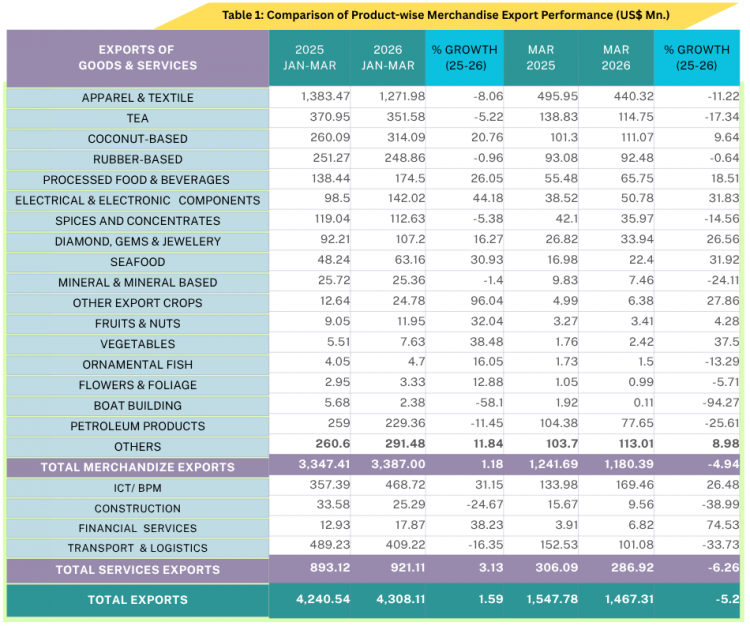
Table 1 shows a comparative analysis of merchandise export performance for March 2025–2026, along with the cumulative figures for the January–March period.
Sri Lanka’s Export Performance in Major Markets
Among the top fifteen export markets, the India, China, Italy, Belgium and Japan demonstrated positive year-on-year growth both in March 2026 and cumulatively for the January–March period, indicating emerging market resilience.
Meanwhile, the United States the largest single export destination for Sri Lanka, accounting for approximately 22% of total merchandise exports recorded a decline of 8.42%, reaching US$ 251.74 million in March 2026. Cumulative exports for the period January to March 2026 also registered a marginal decrease of 3.38%, amounting to US$ 749.38 million compared to the corresponding period in 2025.
India consolidated its position as Sri Lanka’s second-largest export destination, surpassing the United Kingdom, with exports growing by 12.02% to US$ 287.49 million during January–March 2026, despite a marginal increment in March 2026. Meanwhile, exports to the United Kingdom declined by 5.84 % to US$ 235.73 million over the same period, reflecting weaker performance in this key European market.
The United Arab Emirates, which has consistently ranked among the top 15 export destinations in recent years, recorded a notable decline of 11.83% during the period from January to March 2026. This negative trend further intensified in March 2026, with a year-on-year contraction of 72.60% in monthly export performance, primarily attributable to geopolitical tensions between the United States and the Gulf region.
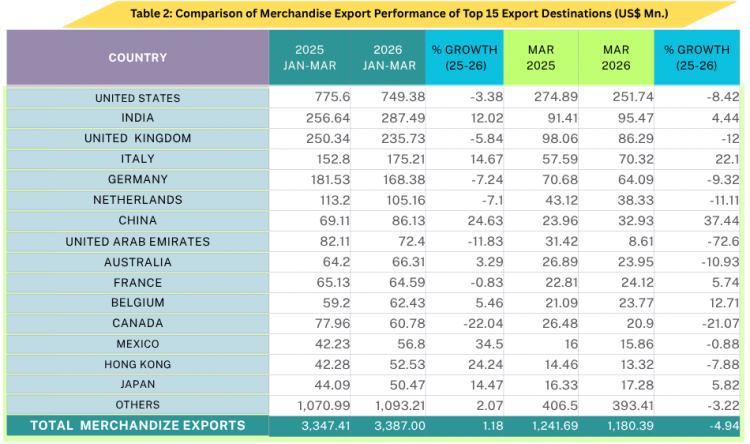
Table 2 shows a comparative analysis of merchandise export performance across the top 15 export markets for March 2025–2026, along with the cumulative figures for the January– March period.
Exports to FTA Partners (India & Pakistan)
a) March 2026
Exports to India and Pakistan together accounted for 8.74% of Sri Lanka’s total merchandise exports in March 2026, totaling US$ 103.11 million, a year-on-year growth of 7.53%
Exports to India increased by 4.44% to US$ 95.47 million, primarily driven by higher demand for key export categories such as petroleum products, animal feed, and selected industrial raw materials, supported by strengthened bilateral trade ties under the Indo-Sri Lanka Free Trade Agreement.
Exports to Pakistan gradually increased by 70.54 % to US$ 7.64 million, supported by higher shipments of other textile articles, desiccated coconut, and chemical products.
b) January – March 2026
Over the cumulative January – March period, exports to India expanded significantly by 12.02 % to US$ 287.49 million. The growth was driven primarily by higher shipments of Petroleum oils, Animal feed, and Areca nuts.
Meanwhile, exports to Pakistan surged by 41.39% to US$ 22.41 million, reflecting robust performance in other textile articles, betel leaves, desiccated coconut, woven fabrics, and base metal products.
Sri Lanka’s Export Performance in Regions
Table 3 shows the comparison of region wise exports for March 2025 – 2026, along with the cumulative figures for the January–March period.
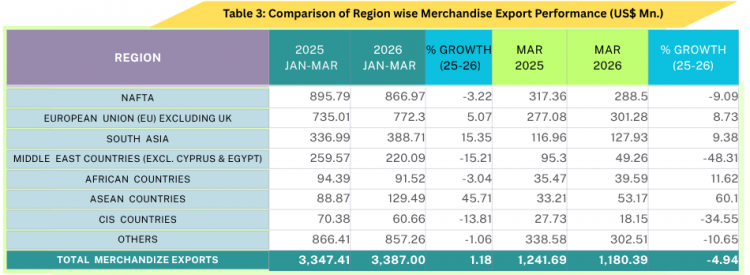
Exports to the European Union (EU), which represent 25.5% of Sri Lanka’s total merchandise exports, increased by 8.73% in March 2026. Similarly, during the cumulative period from January to March 2026, they increased by 5.07%.
Exports to the top five EU markets were recoded as; Italy US$ 175.21 Mn (increased by 14.67 %), Germany US$ 168.38 Mn (decreased by 7.24%), Netherlands US$ 105.16 Mn (decreased by 7.10 %), France US$ 64.59 Mn (decreased by 0.83%) and Belgium US$ 62.43 Mn (increased by 5.46 %) during the cumulative period of January to March 2026 in comparison to the corresponding period in 2025.
Video Story