June, 22, 2021
Export Performance for May 2021 and the period of January – May 2021
Sri Lanka’s export sector performance has been able to managed its growth momentum in May 2021 with the challenges of this pandemic. “We are happy to see that export levels are reaching fast to the pre-Covid 19 levels despite the continuous multiple challenges faced by our exporters with intermittent travel restrictions and local area isolations. Maximum efforts are be taken to secure the export orders in hand while attracting new orders to the country – the responsibility of the authorities are to facilitate the exporters in every possible way to keep them operating”, Chairman, EDB.
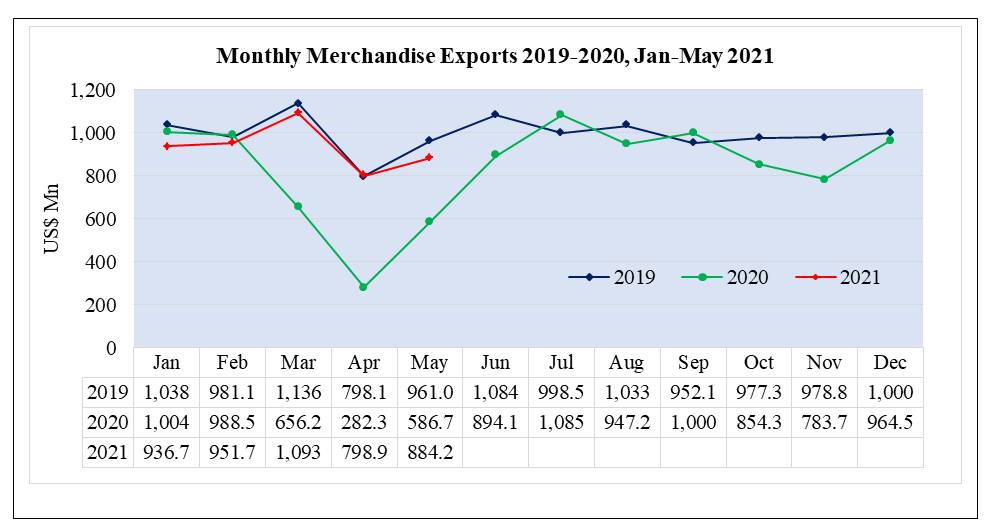
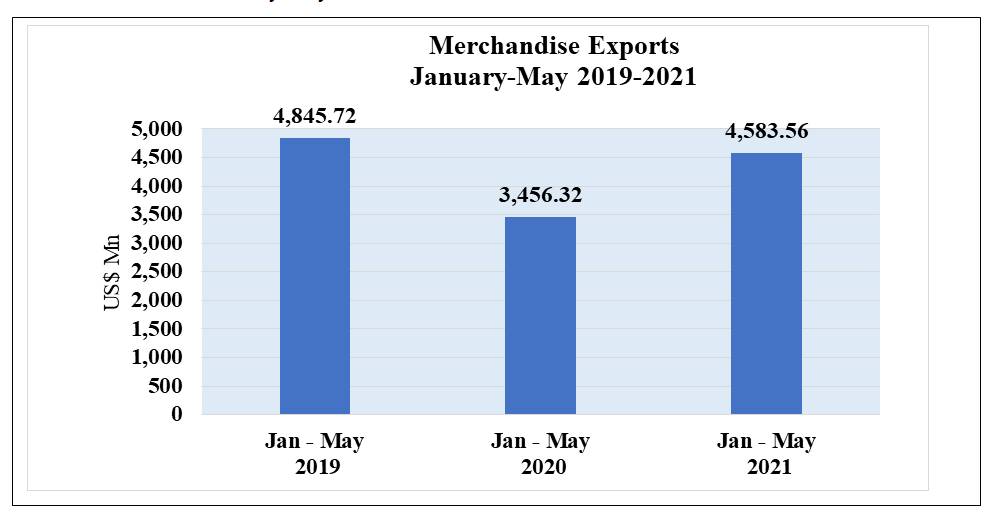
As per the statistics released by the Sri Lanka Customs, Sri Lanka’s merchandise exports in May 2021 was US$ 884.2 Million, an increase of 50.71% over US$ 586.7 Million in May 2020. Sri Lanka’s merchandise exports in January-May 2021 was US$ 4,583.56 Million, an increase of 32.61% over US$ 3,456.32 Million in January-May 2020.
Export Performance in Major Sectors
In May 2021, all the products recorded a positive growth except vegetables and other export crops. A Strong Export Growth was recorded for almost all products during the period of January to May 2021 except petroleum products, vegetables and other export crops.
Exports of Rubber based products, Coconut products and Spices & Concentrates recorded the highest export value thus far.
Major exports in May 2021:
Major exports in January-May 2021:
For the period of January to May 2021, merchandise exports increased by 32.61% to US$ 4,583.56 Million compared to the same period of 2020, following increased exports of Apparel, Rubber-based products, Electronics & Electronic Components, Spices and Concentrates as shown in the table below.
Export earnings from Rubber & Rubber finished products increased by 51.43 % to US$ 424.47 Mn in Jan-May 2021 due to the better performance of exports of Industrial & Surgical Gloves of Rubber (89.04%) and Pneumatic & Retreated Rubber Tyres & Tubes (48.77%).
Earnings from all the major categories of Coconut based products increased due to the improved performance in export of Coconut Oil, Desiccated Coconut, Coconut Milk Powder, Liquid Coconut Milk, Cocopeat, Mattress Fiber, & Activated Carbon.
Meanwhile earnings from export of Electrical and Electronic Components (EEC) increased by 45.29% to US$ 164.28 Mn in the period of January to May 2021 compared to the corresponding period of 2020. Export of Insulated wires increased by 54.10 % in during the period of January to May 2021 to US$ 27.6 Mn compared with the corresponding period of previous year. In addition, export of other Electrical & Electronic Products increased by 51.82 % in during the period of January to May 2021 to US$ 90 Mn compared with the corresponding period of previous year.
Export earnings from Spices and Essential Oils increased significantly in the period of January to May 2021 compared to year 2020 due to the better performance in all the sub categories; Cinnamon, pepper, cloves, nutmeg, etc.
Table 1: Merchandise Export Performance
Values in US$ Mns
| Exports of Goods | Jan-May
2019 |
Jan-May
2020 |
Jan-May
2021 |
% Growth (20-21) | May
2020 |
May
2021 |
% Growth (20-21) |
| Apparel | 2,248.68 | 1,534.61 | 2,064.17 | 34.51 | 218.83 | 370.87 | 69.48 |
| Tea | 571.77 | 456.72 | 526.62 | 15.30 | 108.28 | 109.23 | 0.88 |
| Rubber-based products | 376.33 | 280.31 | 424.47 | 51.43 | 51.19 | 91.18 | 78.12 |
| Coconut-based products | 259.50 | 216.63 | 317.19 | 46.42 | 51.80 | 66.71 | 28.78 |
| Electronics & Electronic Components | 162.26 | 113.07 | 164.28 | 45.29 | 21.66 | 35.19 | 62.47 |
| Spices and Concentrates | 119.65 | 82.77 | 162.01 | 95.74 | 19.29 | 25.24 | 30.84 |
| Food & Beverages | 158.57 | 124.70 | 147.66 | 18.41 | 23.88 | 30.23 | 26.59 |
| Diamond, Gems & Jewelery | 134.50 | 61.04 | 107.04 | 75.36 | 6.61 | 14.19 | 114.67 |
| Seafood | 122.18 | 74.79 | 90.60 | 21.14 | 11.53 | 15.05 | 30.53 |
| Ornamental Fish | 6.91 | 4.40 | 5.94 | 35.00 | 0.46 | 0.90 | 95.65 |
| Other Export Crops | 11.82 | 29.85 | 23.53 | -21.17 | 5.08 | 4.53 | -10.83 |
| Vegetables | 13.53 | 9.66 | 9.57 | -0.93 | 1.75 | 1.74 | -0.57 |
| Fruits | 17.97 | 14.19 | 14.82 | 4.44 | 2.83 | 2.84 | 0.35 |
| Flowers & Foliage | 8.36 | 5.16 | 5.69 | 10.27 | 0.80 | 0.94 | 17.50 |
| Boat Building | 2.86 | 1.33 | 1.48 | 11.28 | 0.42 | 0.53 | 26.19 |
| Petroleum Products | 133.45 | 141.01 | 51.12 | -63.75 | 27.07 | 27.71 | 2.36 |
| Others | 497.38 | 306.08 | 467.37 | 52.70 | 35.22 | 87.14 | 147.42 |
| Total Merchandize Exports | 4,845.72 | 3,456.32 | 4,583.56 | 32.61 | 586.70 | 884.22 | 50.71 |
Sri Lanka’s Export Performance in Major Markets
Strong Export Growth recorded for top 10 export markets in the month of May 2021 and the period of January to May 2021.
The single largest export destination of United States of America recorded US$ 1,133.71 Mn worth of exports in the period of January to May 2021– a significant year on year increase of 25.26 % in comparison to US$ 905.1 Mn recorded in 2020.
Exports to United Kingdom as the second largest trading partner recorded an increase of 23.47% to US$ 366.53 Mn during the period of January to May 2021 compared with the corresponding period of previous year.
Further, Exports to Netherlands and China increased y-o-y by 63.71 % and 61.34 % in Mayl 2021 with cumulative increases of 83.87 % and 64.25% respectively during the period of January to May 2021. Growth of the Netherlands is due to the export of Apparel and Liquid Coconut Milk while Bulk tea, Mineral Sands, Activated Carbon and Cocopeat exports contributed for increase figures in China.
Top 10 Export Destinations
| Country | Jan-May
2020 |
Jan-May
2021 |
% Growth (20-21) | May
2020 |
May
2021 |
% Growth (20-21) | |
| 1 | United States | 905.10 | 1,133.71 | 25.26 | 145.51 | 213.11 | 46.46 |
| 2 | United Kingdom | 296.21 | 366.53 | 23.74 | 42.56 | 72.29 | 69.85 |
| 3 | India | 220.53 | 302.63 | 37.23 | 38.08 | 55.28 | 45.17 |
| 4 | Germany | 195.85 | 286.00 | 46.03 | 35.63 | 53.80 | 51.00 |
| 5 | Italy | 135.66 | 226.02 | 66.61 | 18.09 | 40.45 | 123.60 |
| 6 | Belgium | 94.35 | 132.18 | 40.10 | 15.65 | 26.71 | 70.67 |
| 7 | Netherlands | 88.16 | 162.10 | 83.87 | 16.56 | 27.11 | 63.71 |
| 8 | China | 71.21 | 116.96 | 64.25 | 12.96 | 20.91 | 61.34 |
| 9 | Canada | 71.92 | 114.98 | 59.87 | 12.73 | 20.47 | 60.80 |
| 10 | Turkey | 68.27 | 81.43 | 19.28 | 15.72 | 15.98 | 1.65 |
| Other Markets | 1,309.07 | 1,661.04 | 26.89 | 233.21 | 338.11 | 44.98 | |
| Total Merchandise Exports | 3456.32 | 4583.56 | 32.61 | 586.70 | 884.22 | 50.71 |
On a region wise comparison exports to all other regions increased except CIS and African Countries during the period of January to May 2021 compared with the corresponding period of the previous year.
Export Regions
| Region | Jan-May
2020 |
Jan-May
2021 |
% Growth (20-21) | May
2020 |
May
2021 |
% Growth (20-21) |
| EU excluding UK | 741.95 | 1,135.99 | 53.11 | 128.84 | 210.05 | 63.03 |
| United States | 905.10 | 1,133.71 | 25.26 | 145.51 | 213.11 | 46.46 |
| South Asia | 333.13 | 455.88 | 36.85 | 50.58 | 94.87 | 87.56 |
| ASEAN Countries | 80.79 | 123.63 | 53.03 | 14.94 | 23.58 | 57.83 |
| CIS Countries | 118.30 | 112.52 | -4.89 | 16.60 | 22.94 | 38.19 |
| African Countries | 102.96 | 102.58 | -0.37 | 22.99 | 20.01 | -12.96 |
| Middle East Countries (Excl. Cyprus & Egypt) | 278.86 | 310.32 | 11.28 | 62.14 | 66.39 | 6.84 |
| Others | 895.23 | 1,208.93 | 35.04 | 145.10 | 233.27 | 60.76 |
| Total Merchandise Exports | 3456.32 | 4583.56 | 32.61 | 586.70 | 884.22 | 50.71 |
Export of Services
The services exports estimated by EDB which includes ICT/BPM, Construction, Financial services and Transport & Logistics show exports of US $ 1,194.3 Mn for the period of January to April 2021 compared to US$ 1,021.9 Mn recorded in the corresponding period of 2020. Estimated service exports increased by 16.87 % in the first four months of 2021 compared to the corresponding period of 2020.
Video Story